ACT: Science (optional)
How to read graphs, experiments and competing arguments without memorizing facts
On the exam: Interpreting data, experiments and conflicting viewpoints. Reasoning matters more than memorized facts.
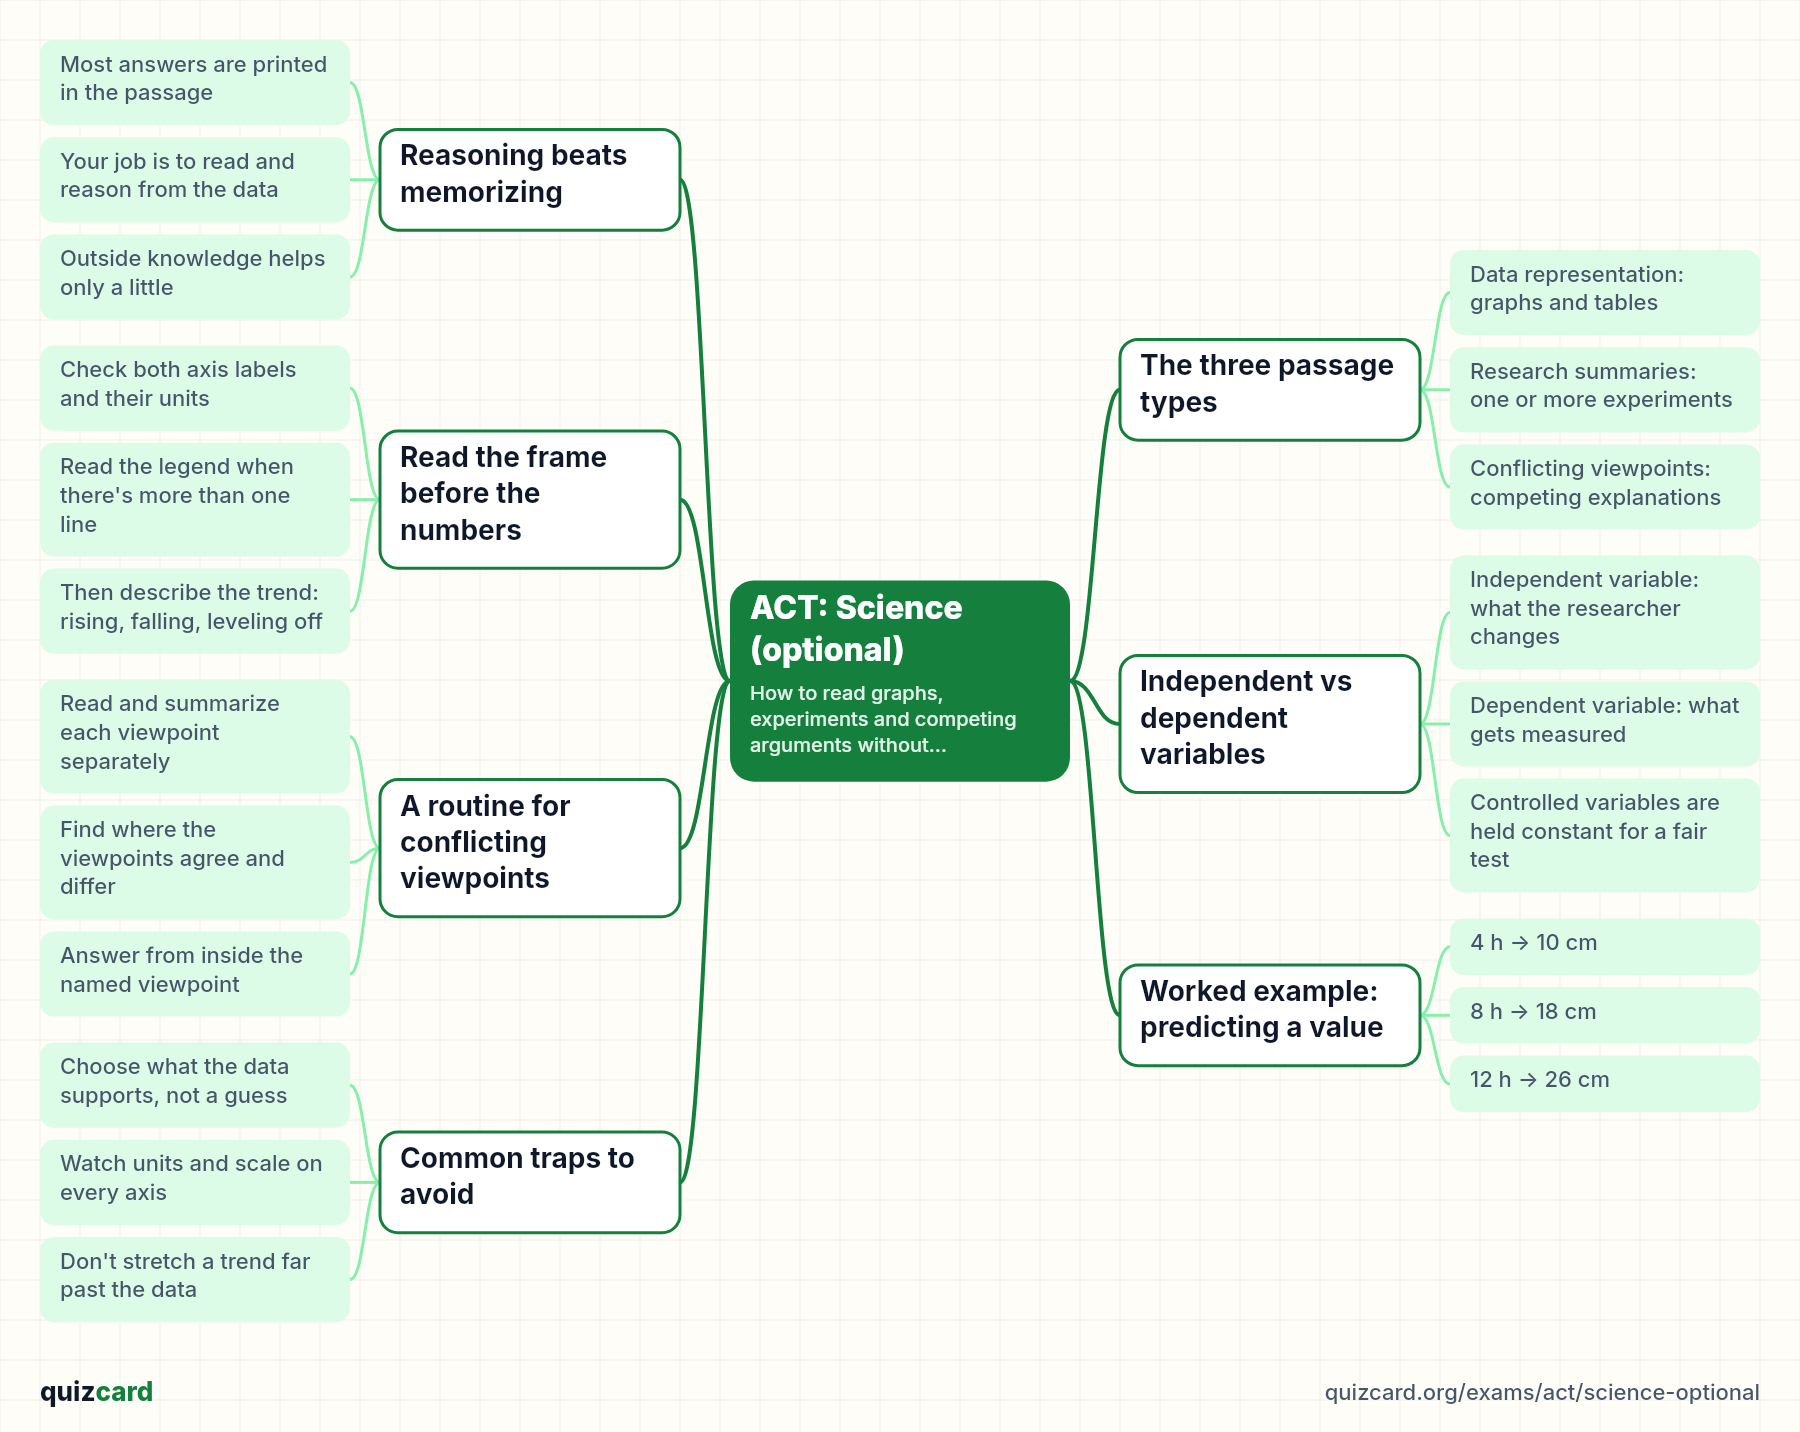
Do you think you need to memorize a pile of science facts to do well here? Most students do, and that's the mistake. The science section of your college entrance test is about reading graphs, experiments, and arguments. We'll cover all three, then work a typical question.
Reasoning beats memorizing
Here's the mindset shift that matters most. This section isn't really a test of how much biology, chemistry, or physics you remember. Almost everything you need is printed right in the passage, in a table, a graph, or a scientist's argument. Your job is to read that information carefully and reason from it. Outside knowledge helps a little, but when they disagree, the data always wins.
Reasoning matters more than memorized facts. The core idea of this section
Key points.
- Most answers are printed in the passage
- Your job is to read and reason from the data
- Outside knowledge helps only a little
The three passage types
You'll see three kinds of passages. Data representation passages give you graphs and tables and ask what they show. Research summaries describe one or more experiments and ask how they were designed and what they found. Conflicting viewpoints passages present two or more scientists or students who explain the same thing differently, and you have to compare their arguments without picking a favorite yourself.
Key points.
- Data representation: graphs and tables
- Research summaries: one or more experiments
- Conflicting viewpoints: competing explanations
Read the frame before the numbers
When you meet a graph, slow down for five seconds and read its frame first. Check what's on the horizontal axis, what's on the vertical axis, and the units on each. Then look at the legend if there's more than one line. Only after that should you notice the trend. Is the line rising, falling, or rising and then leveling off? Most questions are really asking about that shape.
Key points.
- Check both axis labels and their units
- Read the legend when there's more than one line
- Then describe the trend: rising, falling, leveling off
Independent vs dependent variables
In a research summary, the first thing to sort out is which variable was changed on purpose and which was measured. The independent variable is the one the researcher sets, like hours of light given to a plant. The dependent variable is the result, like how tall the plant grows. Everything else, such as water and soil type, is held constant, and those controlled variables make the comparison fair.
Independent variable
- Deliberately changed by the researcher
- Usually on the horizontal axis
- Example: hours of light per day
Dependent variable
- Measured as the result
- Usually on the vertical axis
- Example: plant height in centimeters
A routine for conflicting viewpoints
Conflicting viewpoints passages feel the hardest, so give them a routine. Read one viewpoint at a time, and after each one, sum it up in a few words in the margin. Then notice where the scientists agree, because questions love asking what both would accept. When a question asks what Scientist 2 would predict, answer as Scientist 2, even if you personally think that view is wrong.
- Read one viewpoint at a time
- Summarize each in a short phrase
- Mark where they agree and differ
- Answer using only that viewpoint's claims
Worked example: predicting a value
Here's a typical question. Plants get four, eight, or twelve hours of light a day and grow to ten, eighteen, and twenty six centimeters. How tall would a plant with ten hours most likely be: fourteen, twenty, twenty two, or thirty? Each extra four hours adds eight centimeters, which is two per hour. Ten hours is two past eight, so eighteen plus four gives twenty two, choice C.
4 h → 10 cm
8 h → 18 cm
12 h → 26 cm
+4 h → +8 cm, so 2 cm per h
10 h: 18 + 2×2 = 22 cm
Answer: C
Key points.
- Find the pattern in the data
- Interpolate between known points
- Plants at 10 hours: about 22 cm, choice C
Common traps to avoid
A few traps catch people again and again. Some wrong answers sound scientifically true but aren't supported by this passage, so always point to the data that backs your choice. Check units, because grams and kilograms can hide in the same figure. Be careful extending a trend far beyond the measured range, since it might level off. And remember that two things rising together doesn't prove one causes the other.
Key points.
- Choose what the data supports, not a guess
- Watch units and scale on every axis
- Don't stretch a trend far past the data
- A pattern in a table isn't proof of cause
Remember this
Remember: the answer is almost always on the page, in the graph, the experiment, or the argument. Read the frame, find the pattern, and reason from it. Now quiz yourself on these passage types to make it stick.
Practice this unit
- Algebra and Geometry: Essential Formulas quiz18 multiple-choice questions with explanations · no account needed
- SAT Vocabulary: 40 High-Frequency Words quiz24 multiple-choice questions with explanations · no account needed
- GRE Quantitative: Arithmetic, Algebra, Geometry and Data Formulas quiz15 multiple-choice questions with explanations · no account needed
- Algebra and Geometry: Essential Formulas30 flashcards · study free
- Geometry: Proofs, Triangles, and Circles30 flashcards · study free
- English Literature: Literary Terms and Devices30 flashcards · study free
- SAT Vocabulary: 40 High-Frequency Words40 flashcards · study free
Every ACT deck and quiz: the ACT hub.
Other ACT unit guides
Try it with your own material
Upload a PDF, slides or notes and study the deck in minutes. Making your own cards is free with no limits.